About this blog

'Going Spatial' is my personal blog, the views on this site are entirely my own and should in no way be attributed to anyone else or as the opinion of any organisation.

My tweets on GIS, Humanitarian, Tech, Games and Randomness

Thursday 25 October 2012

Very cool story map from the IUCN Red List

A wonderful story map


Maps can help people tell a story in a far more convincing and compelling fashion than verse and prose alone. Seeing patterns, lines and shapes and how they relate to each adds an extra layer of information that cannot be easily done without a map.


I love Story Maps, and one very eye-catching one is from the IUCN Red List of endangered species.

Here is the link.

Grasshopper
I found it very intuitive, visually pleasing and packed full of relevant and useful information. You can navigate either by selecting the endangered animals icon or through a pick list. The slide bar at the bottom allows you to filter based on the eight categories available ranging from 'Not Evaluated' to Extinct. Simple and easy to use. Hovering the mouse over any of the icons brings a simple tool-tip with a photo and name of the endangered animal. Click on the icon itself and an informative pop-out window with more information is presented including a link to the full assessment information held on the IUCN database. Useful information more or less at one's fingertips packaged up in a smooth and easy to use system.

You know what? I never knew that...

Friday 19 October 2012

Velocity 2012

(Warning: Long Post. TL;DR summary will come soon! I did make a mind-map for each session - scroll right to the bottom of the post to get them)


I attended the Velocity 2012 Conference on the 2nd October. I just signed up for the tuesday tutorials: x4 90-minute topics due to time constraints and workload. Some of my colleagues attended the entire 3-day event. However, I found that the 90-minute sessions had the right amount of depth and breadth to keep me interested.

This is my first Velocity conference, a gathering aimed squarely at the web performance and operations crowd: absolutely perfect for my current job role and my team. Wonder why I never heard of it until now?

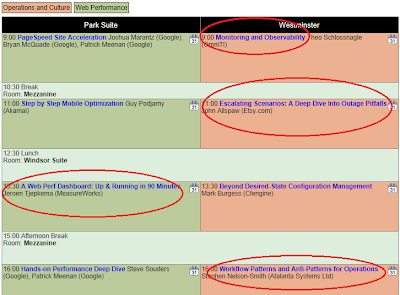
Here's the schedule list.

Velocity 2012 - Tue
My list for the day.


Monitoring and Observability ( Theo Schlossnagle from OMNITI)
This session started with the simple facts that you can’t fix what you can’t see and you can’t improve what you can’t measure. The difference of the two terms was also important: observation is the passive observation of data providing trends and baseline; while monitoring is the direct observation of failure in real-time.

Tuesday 9 October 2012

ArcGIS Online Monthly Cost Calculator

The pricing for Esri's ArcGIS Online is now available here. ArcGIS Online has published it's monthly cost calculator here to help users estimate how much a set of services will cost them. ArcGIS online is a subscription service that allows customers to pay-as-you-go to access maps, services and applications. They are paid for using the Esri Service Credit, which I think it needs a currency symbol and the ISO4217 code - 'ESC' is free if anyone is interested. They are sold in blocks of 1000 credits and each unused credit expires after two years.  The price per Esri credit is dependent on the country the user is in and therefore pricing information is in the local currency.

Eventually, I can see one being able to use this currency to pay for the use of Esri software licenses and even stuff from Esri Press and their store!

That should be fun but we're still some distance from there.

From my own services and projects, it appears the estimating tool tells me that I need 38,290 esri credits (ESC) a year. Now where's the GBP to ESC converter?